The Power of Data Visualization Using Tableau
Select the Right BI Tool: Difference between Power BI and Tableau
Power BI and Tableau are leading tools in the Business Intelligence (BI) space, widely used for collecting, integrating, analyzing, and presenting business data.
These platforms empower organizations to analyze data, manipulate it for deeper understanding, and visualize it to reveal actionable insights.
When choosing which tool to learn or implement, professionals and researchers often find themselves weighing the difference between Power BI and Tableau.
Understanding the Difference between Power BI and Tableau
Power BI, offered by Microsoft, is an all-encompassing analytics service designed to help users analyze, visualize, and share data seamlessly across an organization.
Conversely, Tableau excels as a BI tool that efficiently handles data flow and transforms raw data into interactive visualizations that provide actionable insights.
Both tools are powerful in their own right, but understanding their distinct features can guide users in selecting the one that best fits their needs.
Power BI and Tableau: A Comparative Study
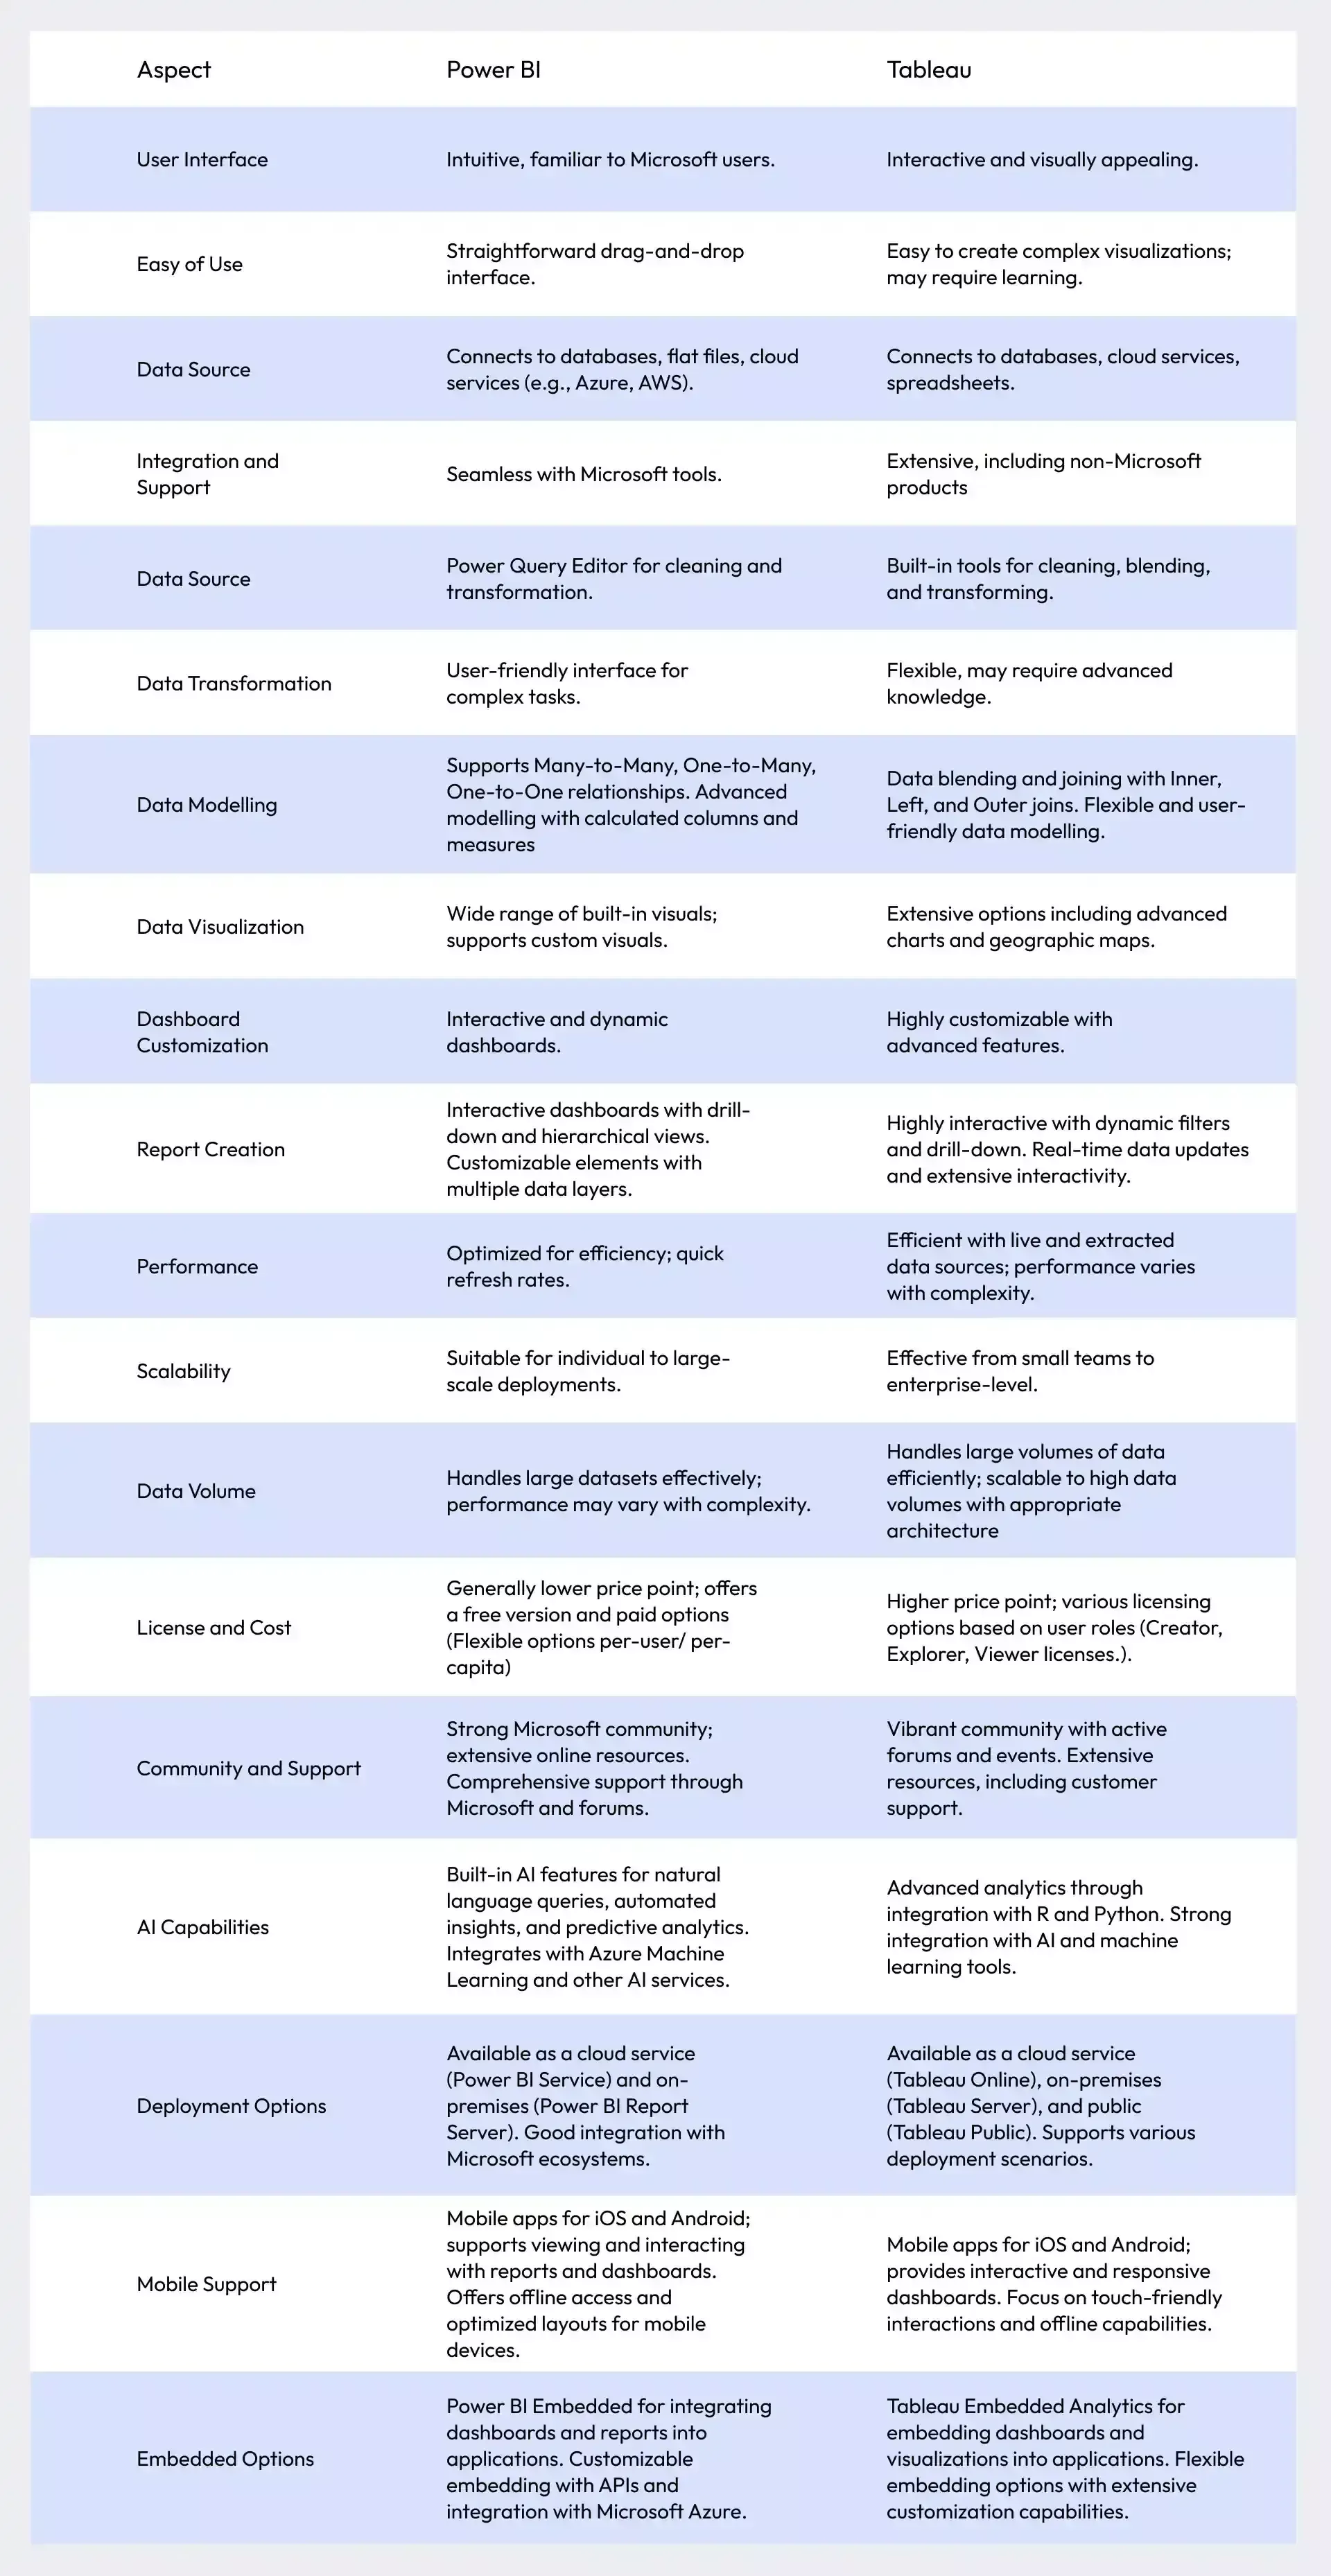
Advantages and Disadvantages of Power BI and Tableau
Besides understanding the basic difference between Tableau and Power BI, it’s important to know about the individual pros and cons of each when choosing the right data visualization tool for your enterprise.
Advantages of Power BI:
- Cost-Effective: Power BI offers a range of pricing options, including a free version and affordable premium plans, making it accessible for various organizations.
- Microsoft Integration: It integrates seamlessly with Microsoft products like Excel and Azure, enhancing productivity and data connectivity.
- Built-in AI Features: Power BI includes features like natural language queries and automated insights, helping users uncover trends and anomalies quickly.
- User-Friendly: The interface is intuitive, especially for those familiar with Microsoft tools, making it easy to start building reports and dashboards.
- Efficient Performance: Businesses can redefine their data usage with embedded Power BI, which has fast data refresh rates and real-time analytics capabilities, ensuring timely insights.
Disadvantages of Power BI:
- Limited Customization: While Power BI offers many built-in visuals, customization options are less extensive compared to Tableau.
- Complex Data Modeling: Advanced data modeling scenarios can be challenging and may not be as robust as Tableau’s offerings.
- On-Premises Limitations: The on-premises version lacks some features available in the cloud service, potentially limiting functionality.
- Handling Large Data: Performance may degrade with very large datasets or highly complex queries.
- Integration Challenges: Integrating with non-Microsoft products can sometimes be cumbersome.
Advantages of Tableau:
- Advanced Visualizations: Tableau provides a wide array of visualization options and customization features, allowing for detailed and interactive data presentations.
- Handles Large Data: It efficiently manages large volumes of data and complex queries, providing robust performance for big data scenarios.
- Flexible Data Modeling: Tableau's data modeling capabilities are highly flexible, accommodating a range of complex data relationships and structures.
- Diverse Deployment Options: Offers various deployment methods, including cloud, on-premises, and public, catering to different organizational needs.
- Strong Analytics Support: Integrates well with R and Python, enabling advanced statistical analysis and machine learning.
Disadvantages of Tableau:
- Higher Cost: Tableau’s pricing is generally higher, which may be a consideration for smaller organizations or those with limited budgets.
- Learning Curve: The extensive features and customization options can result in a steeper learning curve, especially for new users.
- Performance Variability: Performance can vary based on the complexity of visualizations and the size of data sources.
- Complex Integration: Integrating with products outside of Tableau’s ecosystem can sometimes be complex and require additional setup.
- Mobile Experience: While functional, the mobile experience may not be as polished or intuitive as that of Power BI in some cases.
Power BI vs Tableau: Which Should You Choose?
The choice between Power BI and Tableau largely depends on your specific needs and goals.
Both tools offer powerful data visualization and analysis capabilities. However, the difference between Power BI and Tableau lies in the former being more affordable and easier to integrate with Microsoft products and the latter excelling in advanced visualizations and complex analytics.
Ultimately, it’s important to consider factors like cost, system compatibility, data complexity, and certification options before making your decision.
Email us or Talk to us at +91-98367-81929 or Simply Contact Us through the website.
Let's Connect


