The Power of Data Visualization Using Tableau
Extract Actionable Insights from Raw Data using Power BI
In today's data-driven world, businesses generate raw data every day. However, only raw data is not enough to generate actionable insights that can be used to make strategic decisions. Microsoft Power BI is a Business intelligence tool that converts raw data into valuable insights.
The Power of Data: Why Insights Matter
Both extracted oil and newly generated data make sense and its true value is only revealed after it has been refined. The refinement process enables businesses to turn raw data into insights that can inform decisions, forecast trends, and optimize operations. Businesses may lose the opportunity to benefit from data unless they are equipped with the right tools and strategies.
Overview of Power BI
Microsoft Power BI is a business Intelligence tool which enables organizations to generate actionable insights by data analysis. Here Power BI can connect to various types of data sources, e.g. databases, flat files, spreadsheets, and cloud-based or on-premises data warehouses, which allows businesses to analyze and visualize data in the real time.

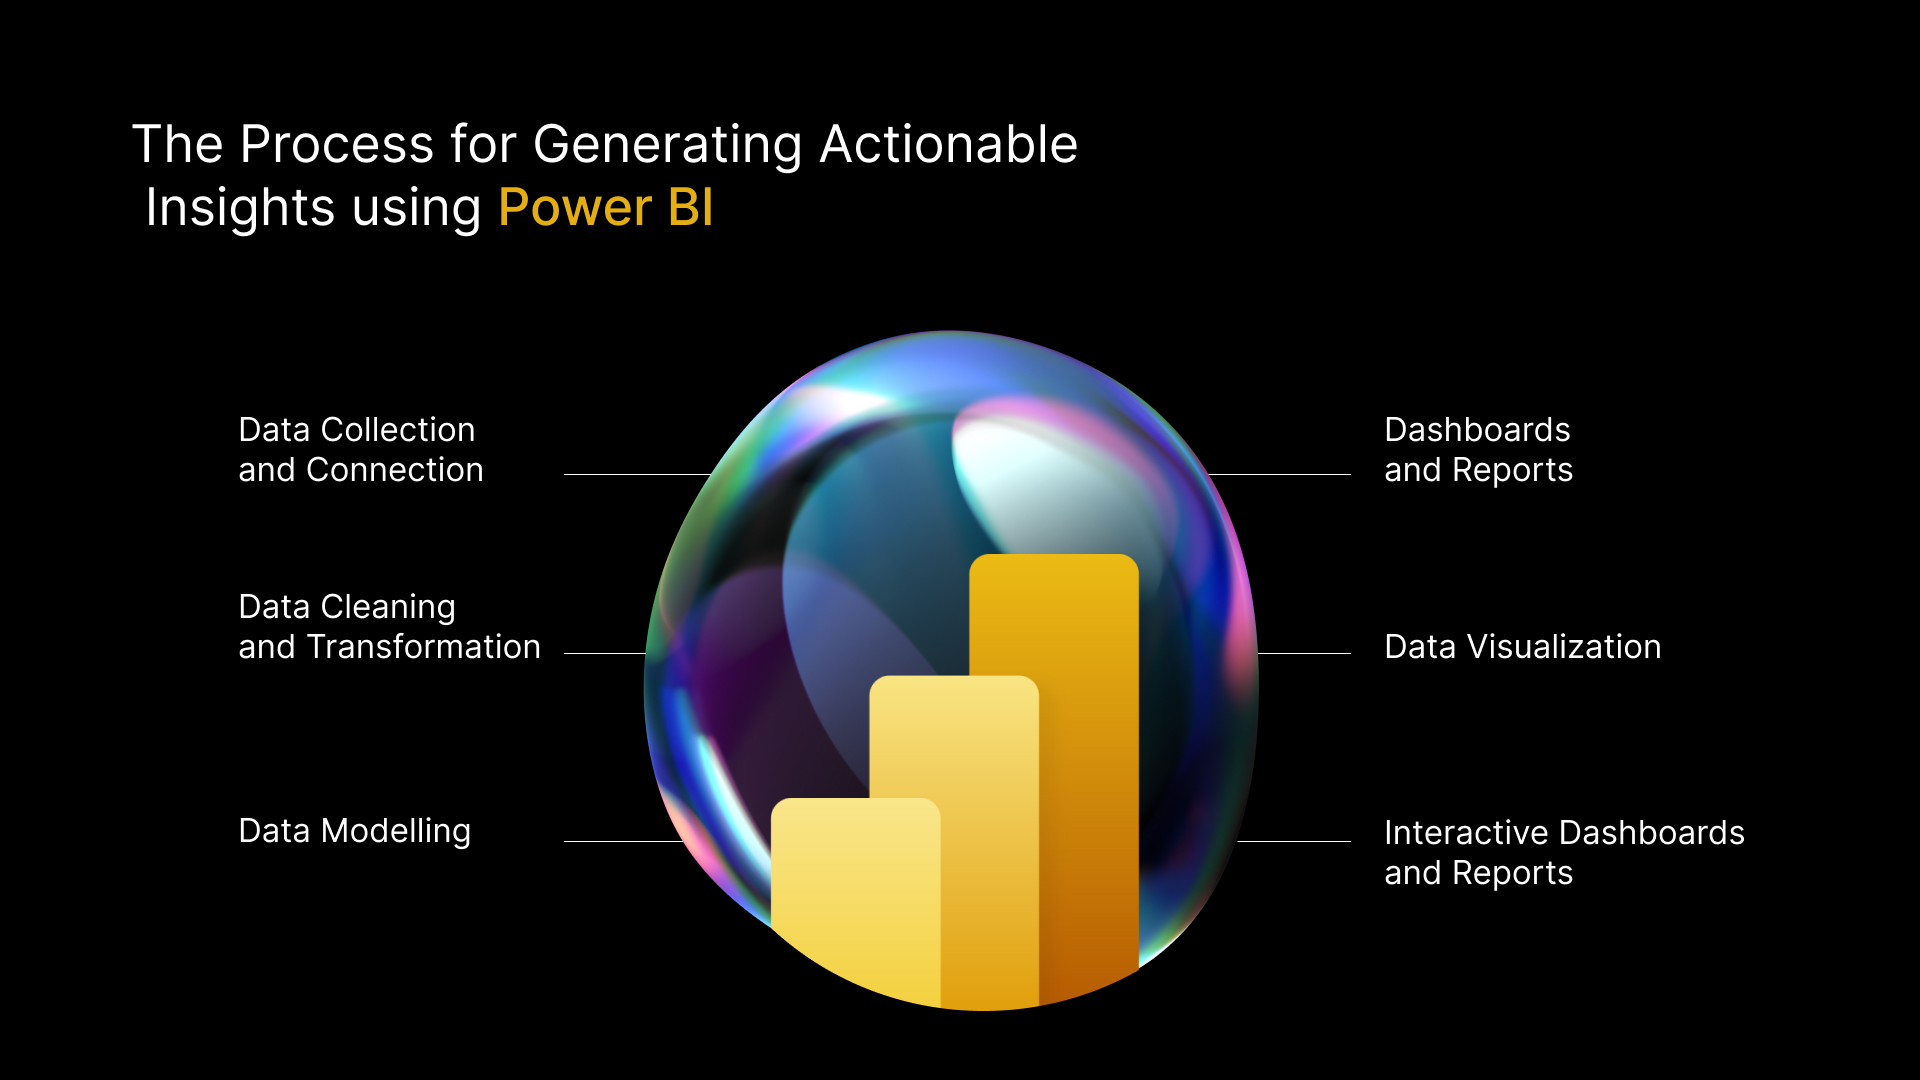
The Process for Generating Actionable Insights using Power BI:
Data Collection and Connection
This is the first step, where Power BI connects to various data sources, including databases, flat files, and cloud data stores like AWS and Azure. This seamless connectivity across multiple sources allows businesses to manage and derive insights from a centralized location, making the entire process more efficient.
Data Cleaning and Transformation
After collecting the data, the next step is to clean and transform it. The power query editor comes with Power BI by default which is a User-friendly interface that simplifies data transformation tasks, including filtering, sorting, managing datatypes, handling nulls and removing duplicates. The main objective of this step is to maintain data quality on the report side, which is the key to obtaining trustworthy insights.
Data Modelling
The modelling section on the Power BI desktop allows to create the models and helps to manage relationships between different datasets. Data modelling involves organizing data to make it easier to explore and analyze. Power BI provides multiple options like Many-to-Many, One-to-Many, and One-to-One cross-functional joining and active-inactive relations. It also allows users to select the direction of data flow, this combination is an added advantage when need to work with large datasets and have multiple dependencies.
Data Visualization
After modelling, the next step is visualization. Power BI has many prebuilt visuals, from bar charts to complex heat maps, and also supports custom visuals which is again an added advantage. These visualizations present insights and aggregated values in various formats, allowing business stakeholders to quickly grasp key insights.
Dashboards and Reports
Power BI allows to produce of interactive dashboards and paginated reports that give a complete view of business. These customizable dashboards support scale options, with the capability to drill down into details as demanded by subcaste. Power BI reports' interactivity empowers druggies to explore data from multiple angles, revealing retired patterns and trends.
Interactive Dashboards and Reports
Power BI allows to produce of interactive dashboards and paginated reports that give a complete view of business. These customizable dashboards support scale options, with the capability to drill down into details as demanded by subcaste. The interactivity of Power BI reports enables druggies to explore data from different angles, uncovering retired patterns and trends.

Real-World Applications: Case Studies
Retail Industries
A large retail company encountered difficulties in monitoring its sales performance across multiple locations and product line. Apart from this, they are lagging in optimizing the operations, where integration of Power BI Reports helps to grab data from various sources and summarize it for the business users.
Power BI enabled the company to clean and transform data at no extra cost and provided real-time insights about sales performance, present stock levels, and transportation details. Apart from that by understanding top-selling products, identifying underperforming regions, and tracking sales trends over time metrics, the company can make data-driven decisions, such as marketing strategies, and maintain inventory levels, resulting in a significant increase in sales and customer satisfaction.
Insurance Company
An Insurance Provider needs to improve their customer service and operational efficiency by analyzing the vast amounts of data. A company faces difficulties due to the volume of the data while identifying trends and areas of problem. Here Power BI can connect and consolidate customer service calls, requests, and maintenance records from various sources, including CRM systems, service databases, and maintenance logs.
With Power BI’s data modelling features, the company created relationships between customer demographics, service request types, response times, and service outcomes. This allowed them to gain a holistic view of operations and customer interactions including customer service performance, identifying patterns in service delays, recurring maintenance issues, and customer satisfaction levels.
Conclusion: Empowering Businesses with Data-Driven Insights
Power BI's intuitive interface, advanced data processing features, and diverse visualization options make it a critical asset for organizations aiming to leverage their data effectively. By utilizing Power BI, businesses can transform their data into a strategic advantage, facilitating smarter decision-making and driving overall success.
Email us or Talk to us at +91-98367-81929 or Simply Contact Us through the website.
Let's Connect


