The Power of Data Visualization Using Tableau
The Power of Data Visualization Using Tableau
With the boon of a data-driven workspace also comes the bane of information that is fragmented and complex. For modern enterprises, clarity and context hold a higher ground than the quantity of data alone. Data visualization using Tableau addresses this gap between diverse, disjointed sources of data and actionable insights.
By combining robust data preparation with story-driven dashboards, Tableau equips decision-makers with clarity, speed, and confidence.
So, how can you use Tableau to transform clusters of data into business intelligence?
Take a look at the best practices for effective data visualization with Tableau, and examine real-world use cases across industries driving measurable results.
Role of Tableau in Data Visualization
Tableau is a leading self-service Business Intelligence (BI) tool designed to help users analyze and visualize data effortlessly.
Since its inception, Tableau has revolutionized the way businesses interact with data, making it accessible to both technical and non-technical users.
Data visualization using Tableau helps organizations convert complex datasets into intuitive dashboards that highlight trends, patterns, and outliers at a glance.
Common Challenges in Data Representation Solved by Tableau
Some of the prominent challenges Many organizations struggle with today are as follows:
- Data overload – Too much information can obscure meaningful insights.
- Misinterpretation – Poorly designed visuals can lead to incorrect conclusions.
- Cognitive biases – Personal biases may influence how data is perceived.
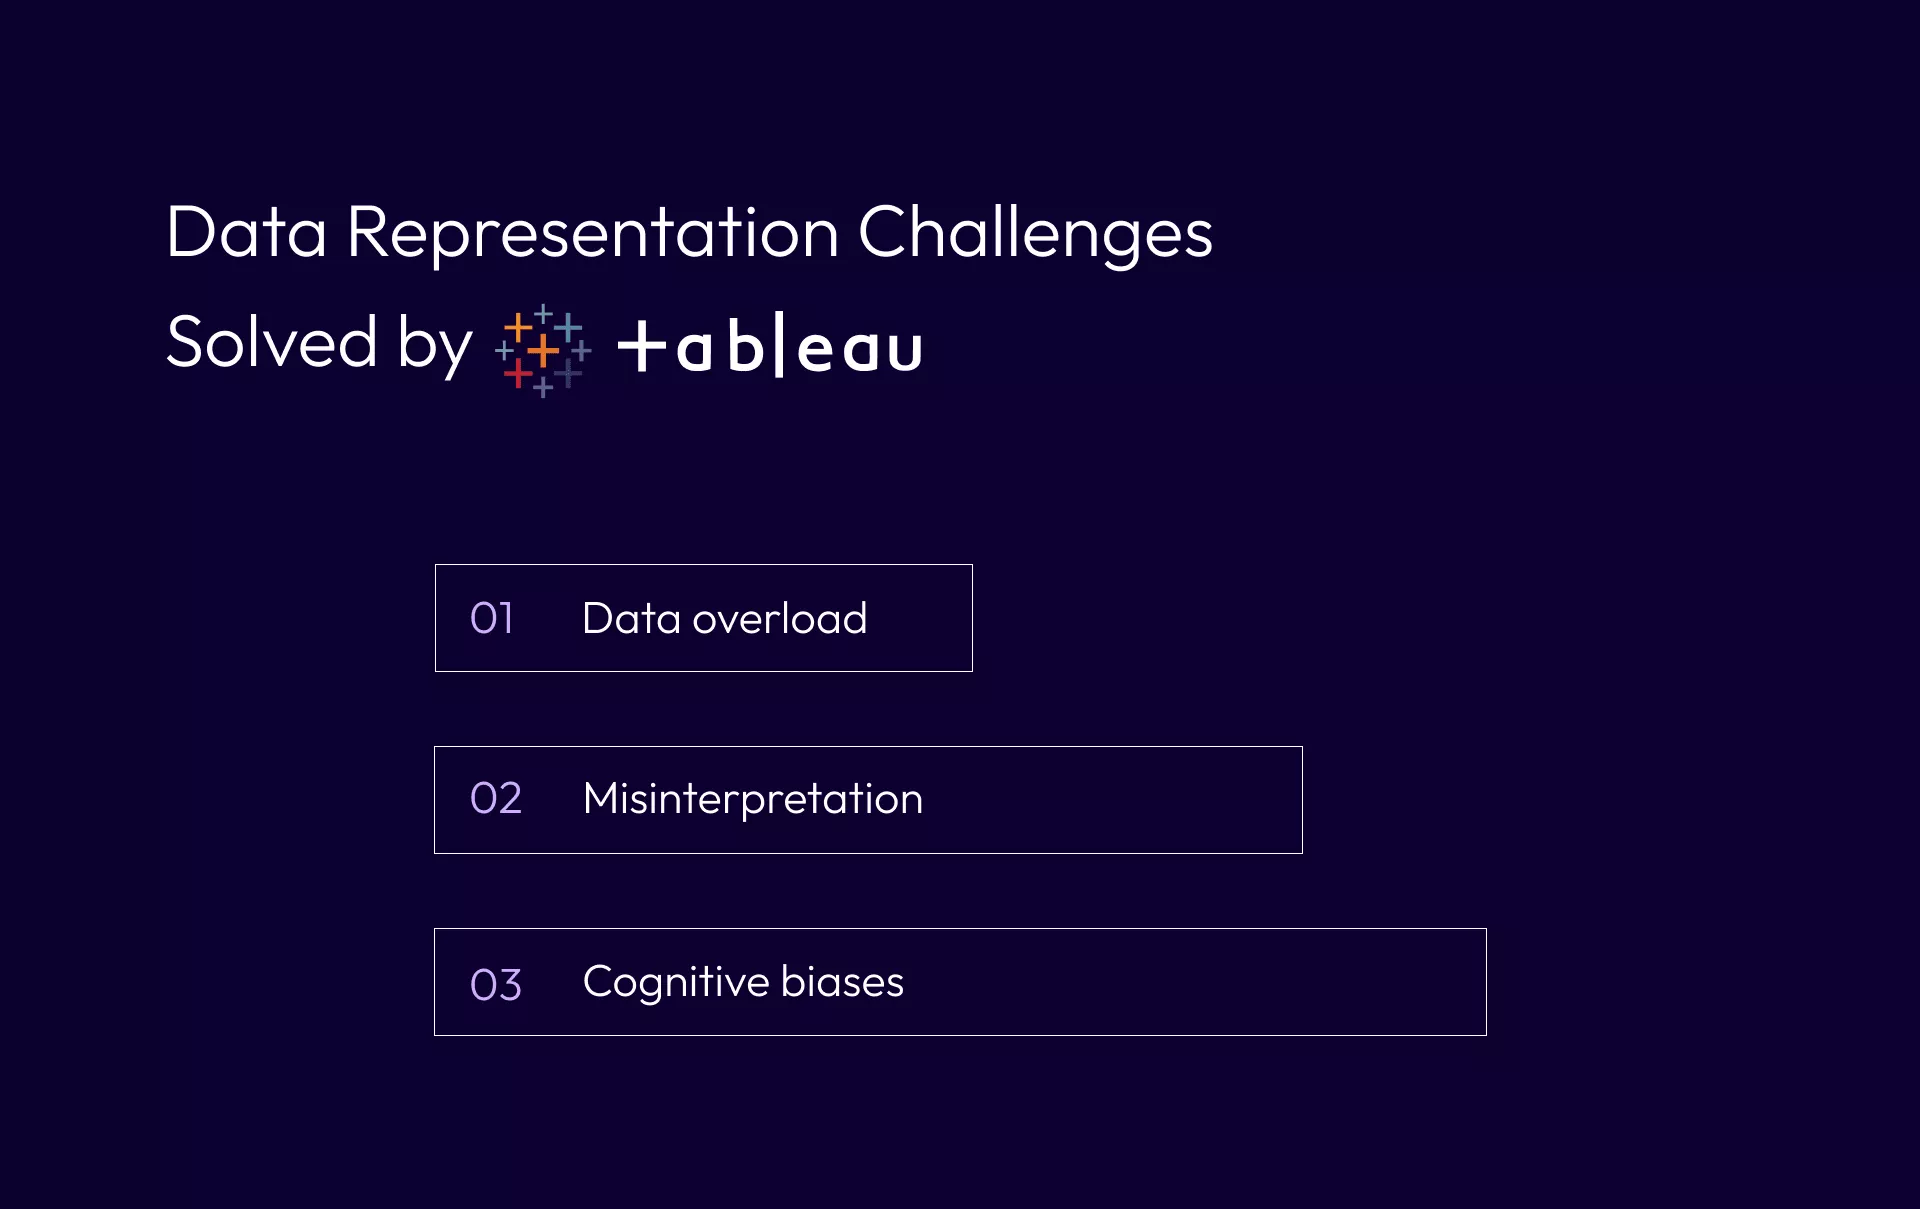
Tableau addresses these challenges by offering interactive and customizable visualization options. It ensures that data is presented in a way that is both accurate and easy to understand.
Key Features of Tableau
By combining powerful analytics with an approachable interface, Tableau enables organizations to visualize data with clarity, collaborate efficiently, and move from insight to action faster.
Here are some notable features of the tool that make it so efficient:
Broad Data Connectivity & Smart Preparation
Tableau simplifies the complex process of gathering and preparing data from diverse sources, ensuring teams spend less time cleaning data and more time analyzing it.
- Multi-source connectivity: Excel, SQL, Oracle, Snowflake, Google BigQuery, AWS, and more
- Tableau Prep Builder: Visual interface for cleaning, joining, and shaping data
- Live or Extract mode: Choose real-time access or high-performance in-memory data extracts
Drag-and-Drop Visual Analytics
Designed for business users, Tableau enables fast, flexible visual exploration without writing a single line of code.
- User-friendly interface: Drag-and-drop elements to build charts and dashboards
- Wide range of visuals: Bar, line, pie, scatter, heatmaps, histograms, Gantt charts, treemaps, etc.
- Responsive design: Automatically adjusts to different screen sizes and devices
Advanced Geospatial Capabilities
Tableau makes spatial data analysis accessible, turning location-based data into strategic insights with just a few clicks.
- Auto geo-detection: Recognizes geographic fields like country, city, ZIP codes
- Custom map layers: Import shapefiles, GeoJSON, and KML for detailed mapping
- Layered maps: Combine multiple data sources to analyze regional patterns and territories
Storytelling with Interactive Dashboards
Tableau goes beyond static charts by enabling interactive, narrative-driven dashboards that engage decision-makers and drive alignment.
- Integrated views: Combine multiple charts into a single dashboard experience
- Interactive filters & parameters: Drill down and explore data dynamically
- Story points: Guide users through a data narrative for deeper engagement
Enterprise-Ready Collaboration & Governance
Built for scale, Tableau supports secure sharing, real-time collaboration, and governed analytics across the enterprise.
- Publishing & access control: Share dashboards via Tableau Server, Cloud, or embedded options
- Role-based permissions: Maintain strict control over who can view, edit, or share data
- Scalable architecture: Supports departmental teams to global deployments
Core Benefits of Using Tableau for Data Visualization
As data volumes grow, the core business advantages of Tableau become even more critical to recognize. Here’s a look at the key benefits it delivers:
Cost-Efficiency and Scalable Licensing
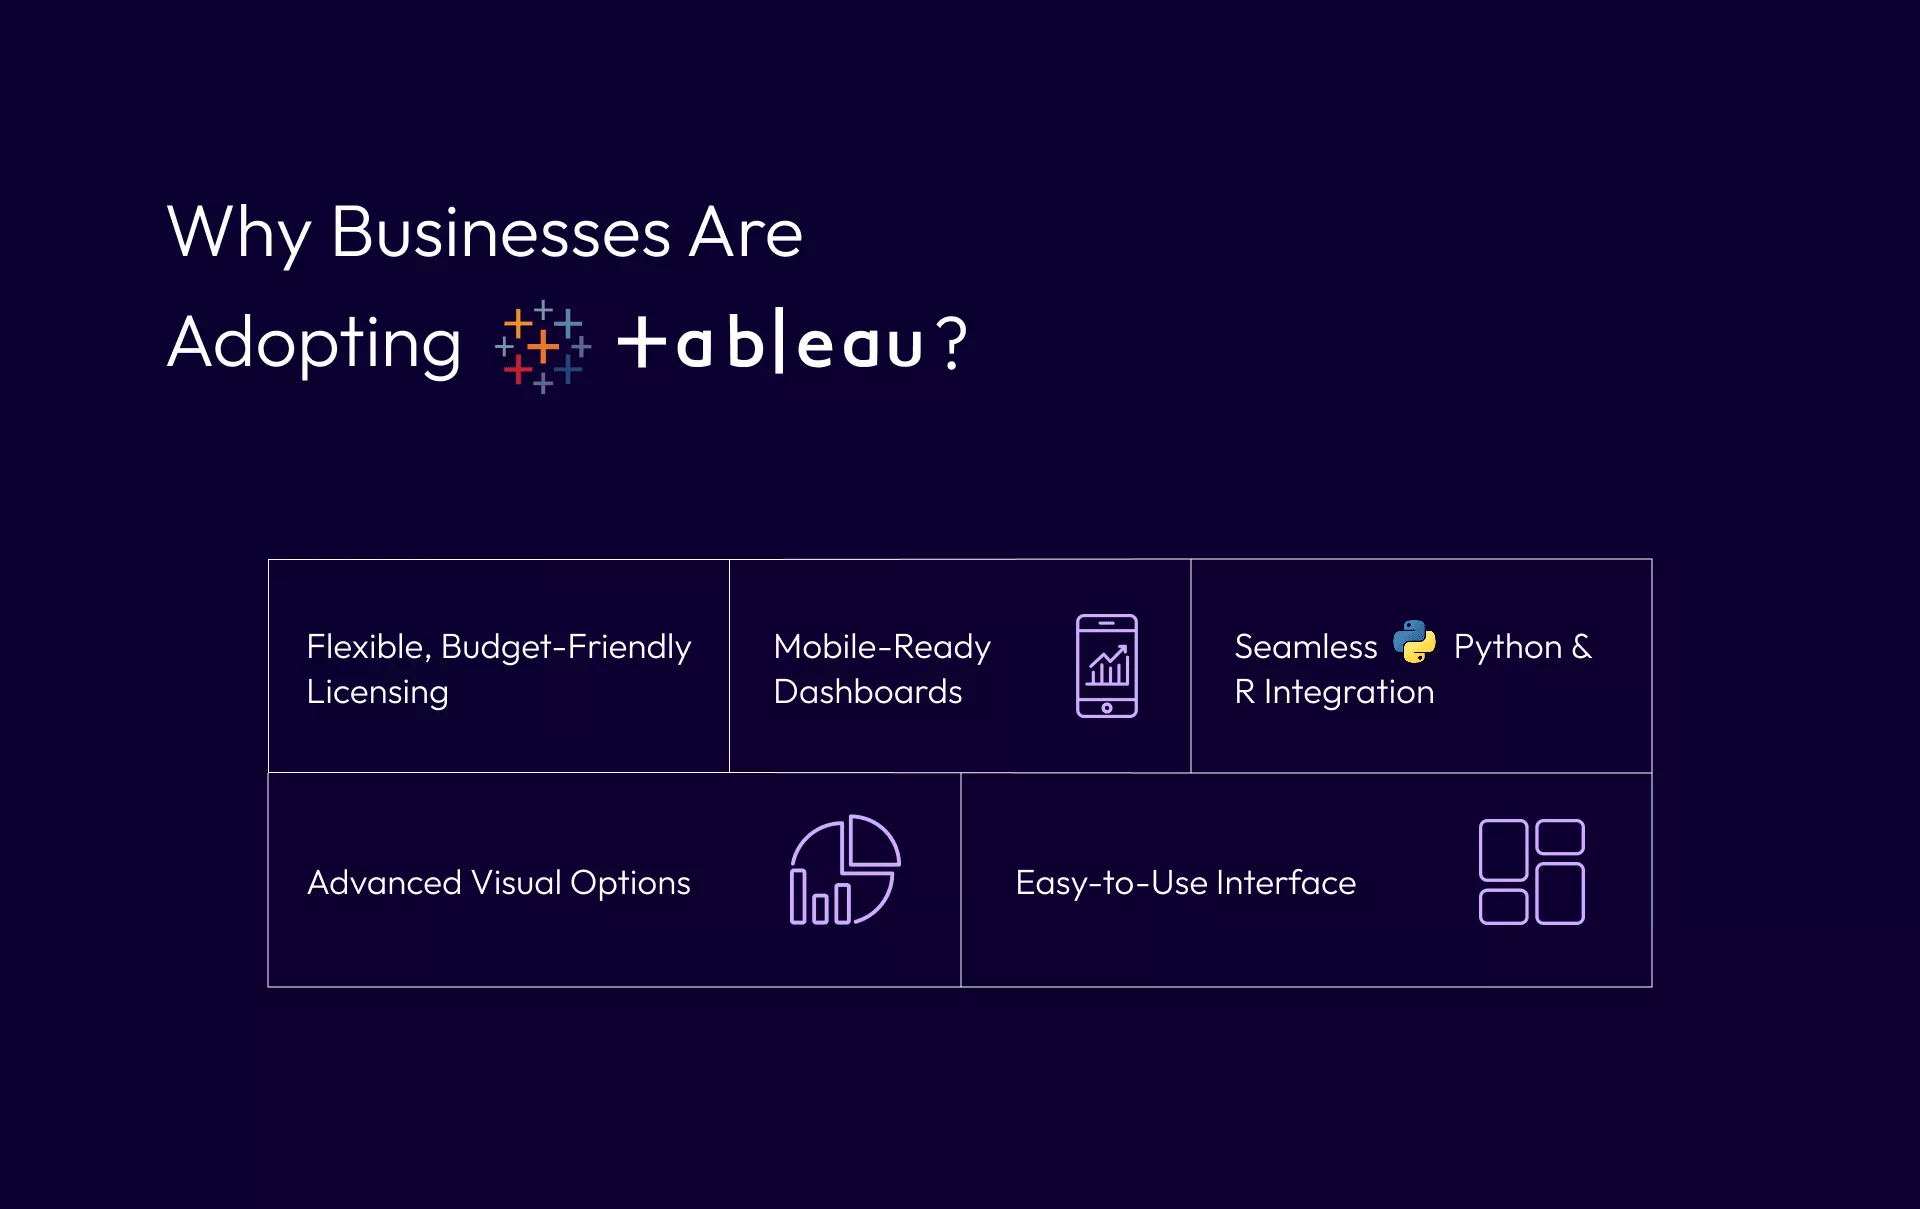
Tableau stands out for its flexible licensing models, making it a cost-effective option, especially for small to mid-sized enterprises. Compared to other platforms like Qlik or Business Objects, Tableau delivers enterprise-grade functionality at a fraction of the cost, without compromising on performance or features.
Mobile Responsiveness for Real-Time Insights
In a mobile-first business environment, Tableau ensures that decision-makers can access dashboards and reports from smartphones or tablets, anytime, anywhere. Its responsive design adjusts to different screen sizes, providing optimal viewing and interaction across devices, keeping business leaders connected to critical data on the go.
Seamless Integration with Scripting Languages
Tableau enhances analytical flexibility by integrating with Python, R, and other popular scripting languages. This allows users to offload heavy computations, run predictive models, and perform advanced statistical analysis, all within Tableau’s environment, enabling deeper insights and faster decision-making.
Rich, Customizable Visualizations
Whether it’s bar charts or geospatial heat maps, Tableau’s visualization options are extensive and customizable, allowing users to create highly engaging, meaningful visuals tailored to business needs.
Intuitive User Experience
Tableau’s drag-and-drop interface makes advanced analytics accessible even to non-technical users, fostering a truly data-driven culture across all business functions.
Best Practices for Effective Data Visualization in Tableau
Creating impactful visualizations requires more than just selecting the right tool. It involves a deep understanding of data representation techniques, user experience design, and storytelling. When used effectively, Tableau can turn raw data into powerful narratives that drive business success.
Choosing the Right Chart Type
Selecting the appropriate chart type is crucial for conveying insights effectively.
Consider the following:
- Bar charts – Best for comparing categorical data.
- Line graphs – Ideal for showing trends over time.
- Heat maps – Useful for identifying correlations in large datasets.
- Scatter plots – Effective for displaying relationships between two variables.
Using the wrong chart type can lead to misinterpretation, so it’s essential to match the visualization to the data context.
Designing Interactive Dashboards
An interactive dashboard enhances user engagement by allowing viewers to filter and drill down into data.
Best practices include:
- Keeping dashboards clean and uncluttered.
- Using filters and parameters for personalized insights.
- Ensuring dashboards are mobile-friendly for accessibility on different devices.
Color and Formatting Strategies
Colors should be used strategically to highlight key insights rather than merely for decoration.
Consider these guidelines:
- Stick to a consistent color scheme to maintain visual coherence.
- Use contrasting colors to emphasize important data points.
- Ensure accessibility by avoiding color combinations that are difficult for color-blind users to distinguish.
Storytelling with Data
Beyond static reports, using Tableau for data visualization allows users to create compelling data stories. The Story feature in Tableau helps guide audiences through a sequence of insights, ensuring that data-driven narratives remain clear and engaging.
Advanced Tableau Techniques for Better Insights
Mastering Tableau goes beyond basic charts and dashboards. Advanced techniques allow users to refine their analysis, automate data preparation, and extract deeper insights that drive strategic decisions. By leveraging these powerful capabilities, businesses can gain a competitive edge in data-driven decision-making.
Using Calculated Fields and Parameters
For deeper analysis, Tableau offers calculated fields, allowing users to create custom formulas for:
- Aggregations (total sales, average revenue).
- Conditional logic (IF statements for segmenting data).
- Dynamic calculations based on user inputs.
Leveraging Tableau Prep for Data Cleaning
Data quality is critical for accurate analysis. Tableau Prep simplifies data cleaning by:
- Identifying missing or duplicate values.
- Merging and transforming data from multiple sources.
- Automating data preparation workflows for efficiency.
Integrating AI and Predictive Analytics
Tableau’s AI-driven features allow users to:
- Forecast trends using built-in predictive models.
- Identify outliers with anomaly detection.
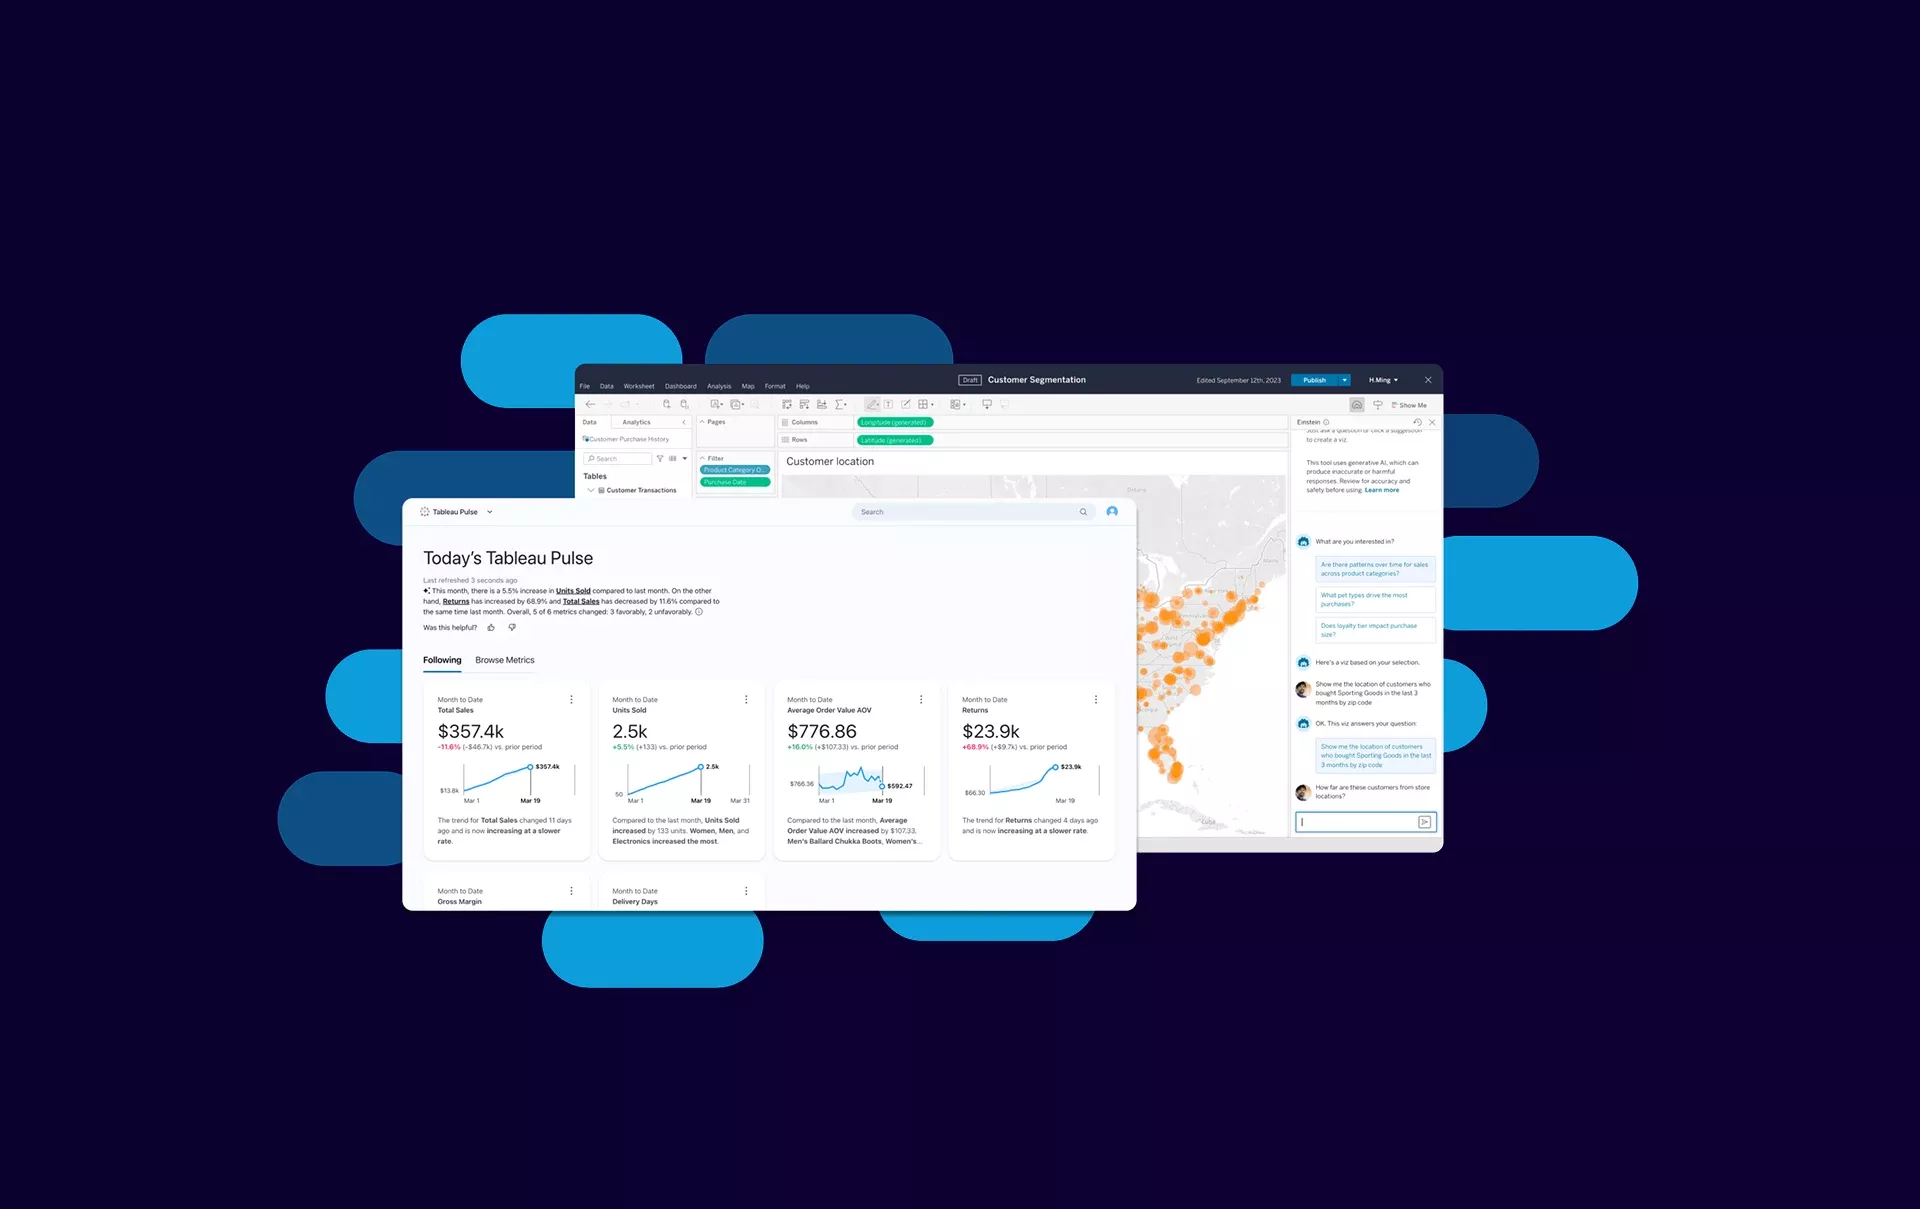
- Gain automated insights through natural language processing.
These capabilities enhance the analytical power of data visualization using Tableau, making it a valuable tool for proactive decision-making.
Real-World Applications of Tableau
Tableau is widely adopted across industries, transforming how businesses and organizations interact with data.
Business Intelligence & Corporate Analytics
Organizations leverage Tableau for:
- KPI tracking – Monitoring financial and operational performance.
- Supply chain optimization – Identifying bottlenecks and improving efficiency.
- Sales performance analysis – Understanding customer trends and forecasting revenue.
Marketing and Customer Insights
Marketing teams use data visualization with Tableau to:
- Track campaign performance across different channels.
- Analyze customer sentiment using social media and survey data.
- Identify market trends to refine targeting strategies.
Healthcare and Public Data Analysis
In the healthcare industry, Tableau helps visualize:
- Patient demographics and treatment outcomes.
- Disease outbreak patterns, such as COVID-19 dashboards.
- Hospital resource allocation for optimizing care delivery.
The Future of Data Visualization with Tableau
Now, you may be wondering, “is Tableau a good visualization tool for my organization?”
The only way to truly judge that is by weighing how other data visualization tools like Power BI compare with Tableau. However, Tableau offers a scalable solution for all levels of expertise, making data interpretation more accessible and efficient for everyone from beginners to experienced analysts.
By following best practices in chart selection, dashboard design, and interactive storytelling, users can find powerful insights that drive better decision-making.
As organizations continue to embrace data-driven strategies, using Tableau for data visualization will remain a crucial skill for analysts, marketers, and decision-makers. If you haven’t explored Tableau yet, connect with us to experience the power of visual analytics firsthand.
Email us or Talk to us at +91-98367-81929 or Simply Contact Us through the website.
Let's Connect


